> ## Documentation Index
> Fetch the complete documentation index at: https://documentation.byteful.com/llms.txt
> Use this file to discover all available pages before exploring further.
# Observability Overview
> Learn how to monitor and analyze proxy usage across hostnames, users, and networks with the Byteful Observability Panel
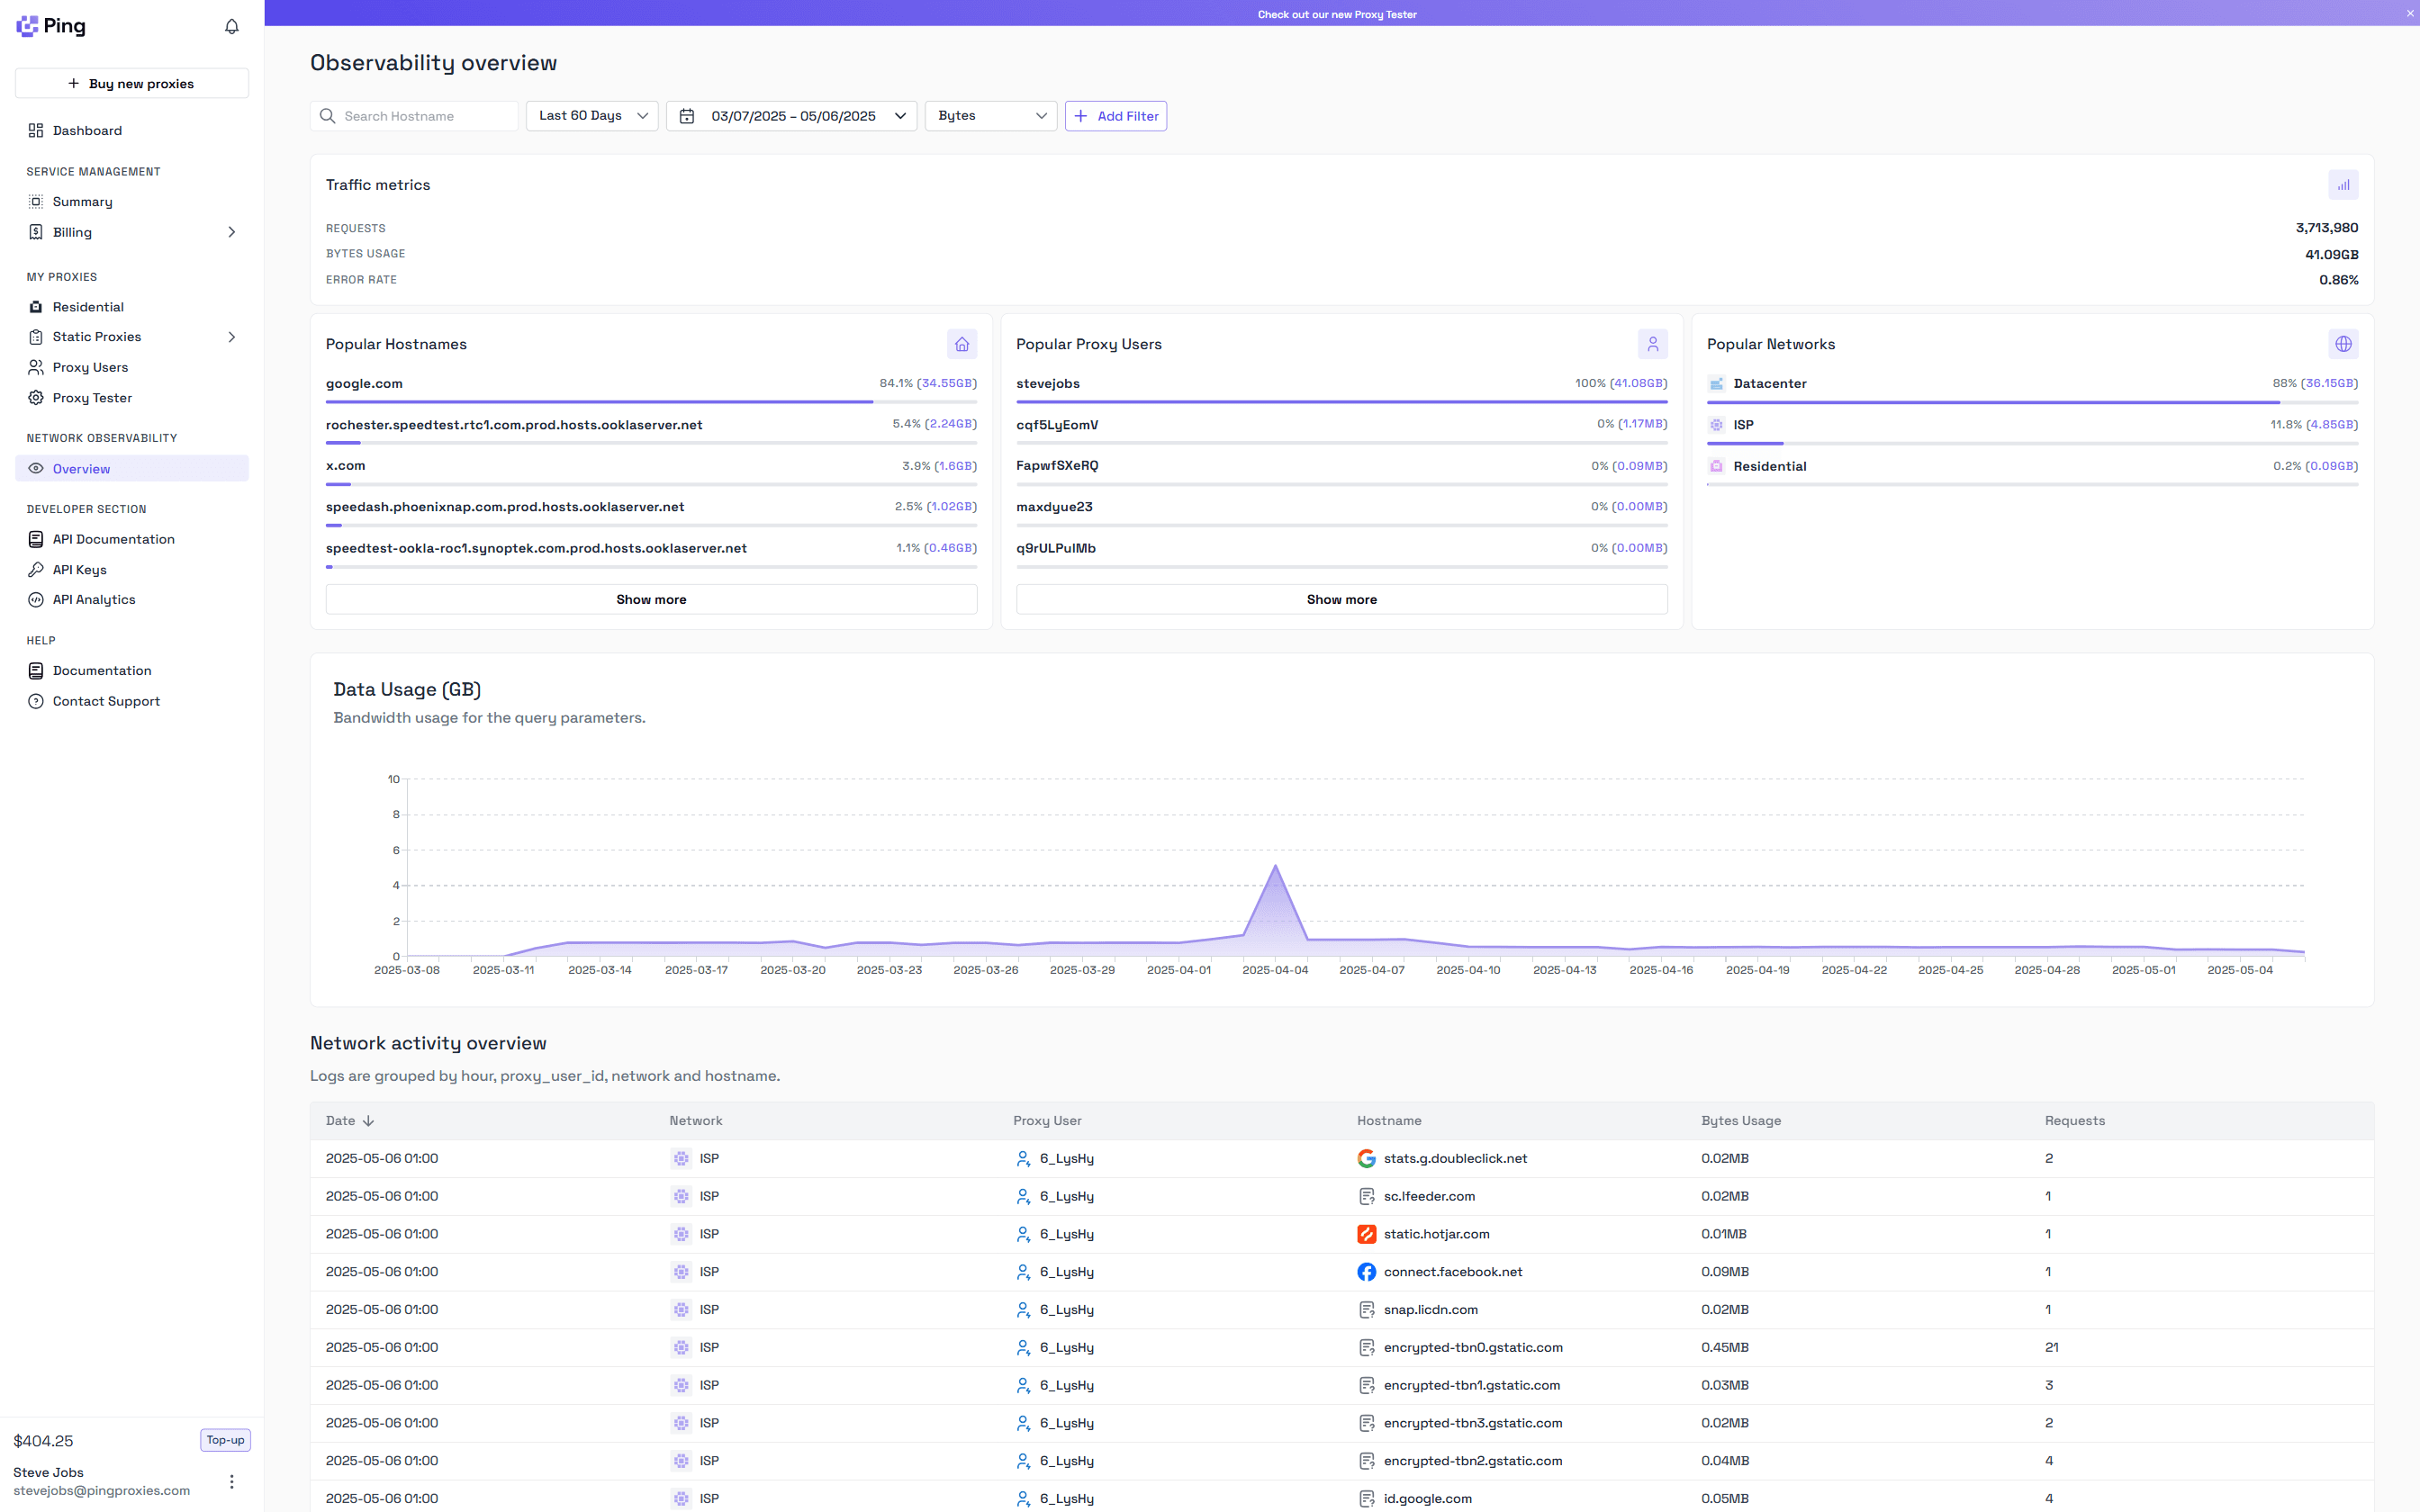 The **Network Observability Panel** provides real-time and historical insights into your proxy infrastructure. This panel is designed to give you comprehensive visibility across all usage dimensions—hostnames, proxy users, networks, and Smartpath® performance metrics—without needing third-party analytics tools.
## Why use Observability?
Whether you are debugging traffic anomalies, optimizing performance, or planning capacity, the Observability Panel helps you make data-driven decisions quickly and confidently. All key metrics and breakdowns are accessible in a single interface with intuitive filtering and real-time updates.
## Key Features
### Real-Time Metrics and Historical Data
* Monitor live traffic as it happens with minimal delay
* Access up to **90 days of historical data** to identify long-term trends and anomalies
* View data usage charts and request volume over time
### Advanced Filtering Options
The panel allows for precise filtering across multiple dimensions:
* Hostname
* Proxy User
* Network Type (Residential, Mobile, ISP, Datacenter)
* Time Span (Custom ranges with support for hourly to 90-day windows)
Filters support advanced operators such as `equals`, `not equals`, `contains`, and `greater than`.
### Top-Level Metrics
The top summary section includes:
* **Requests**: Total number of proxy requests
* **Bytes Usage**: Data consumption in gigabytes
* **Error Rate**: Percentage of failed or errored requests
These metrics update in near real-time and reflect the currently selected date range and filters.
## Hostnames, Users, and Networks
### Top Hostnames
Understand where your traffic is going. The panel lists the top 100 hostnames by:
* Request count
* Data usage
* Error rates
This helps in diagnosing domain-specific issues or validating traffic targets.
We may summarise hostnames in the format \*.hostname.TLD when we detect high cardinality between a large number of hostnames.
### Top Proxy Users
Gain visibility into your heaviest users:
* Track request volume and data consumption per user
* Identify abnormal usage patterns
* Pinpoint users causing elevated error rates
### Network Distribution
View traffic split by:
* Residential
* Mobile
* ISP
* Datacenter
Percentages and total volume are displayed clearly to assess distribution across your available network types.
## Smartpath® Metrics
If Smartpath is enabled for your account, the observability panel includes the following metrics:
| Metric | Description |
| --------------------- | ----------------------------------------------------- |
| AI Optimized Requests | Number of requests routed intelligently via Smartpath |
| AI Optimized Bytes | Data optimized through Smartpath routing decisions |
| Money Saved | Estimated cost savings achieved with Smartpath |
These metrics are filterable and help measure Smartpath’s impact across specific users, domains, and time periods.
The **Network Observability Panel** provides real-time and historical insights into your proxy infrastructure. This panel is designed to give you comprehensive visibility across all usage dimensions—hostnames, proxy users, networks, and Smartpath® performance metrics—without needing third-party analytics tools.
## Why use Observability?
Whether you are debugging traffic anomalies, optimizing performance, or planning capacity, the Observability Panel helps you make data-driven decisions quickly and confidently. All key metrics and breakdowns are accessible in a single interface with intuitive filtering and real-time updates.
## Key Features
### Real-Time Metrics and Historical Data
* Monitor live traffic as it happens with minimal delay
* Access up to **90 days of historical data** to identify long-term trends and anomalies
* View data usage charts and request volume over time
### Advanced Filtering Options
The panel allows for precise filtering across multiple dimensions:
* Hostname
* Proxy User
* Network Type (Residential, Mobile, ISP, Datacenter)
* Time Span (Custom ranges with support for hourly to 90-day windows)
Filters support advanced operators such as `equals`, `not equals`, `contains`, and `greater than`.
### Top-Level Metrics
The top summary section includes:
* **Requests**: Total number of proxy requests
* **Bytes Usage**: Data consumption in gigabytes
* **Error Rate**: Percentage of failed or errored requests
These metrics update in near real-time and reflect the currently selected date range and filters.
## Hostnames, Users, and Networks
### Top Hostnames
Understand where your traffic is going. The panel lists the top 100 hostnames by:
* Request count
* Data usage
* Error rates
This helps in diagnosing domain-specific issues or validating traffic targets.
We may summarise hostnames in the format \*.hostname.TLD when we detect high cardinality between a large number of hostnames.
### Top Proxy Users
Gain visibility into your heaviest users:
* Track request volume and data consumption per user
* Identify abnormal usage patterns
* Pinpoint users causing elevated error rates
### Network Distribution
View traffic split by:
* Residential
* Mobile
* ISP
* Datacenter
Percentages and total volume are displayed clearly to assess distribution across your available network types.
## Smartpath® Metrics
If Smartpath is enabled for your account, the observability panel includes the following metrics:
| Metric | Description |
| --------------------- | ----------------------------------------------------- |
| AI Optimized Requests | Number of requests routed intelligently via Smartpath |
| AI Optimized Bytes | Data optimized through Smartpath routing decisions |
| Money Saved | Estimated cost savings achieved with Smartpath |
These metrics are filterable and help measure Smartpath’s impact across specific users, domains, and time periods.
 ## Network Activity Table
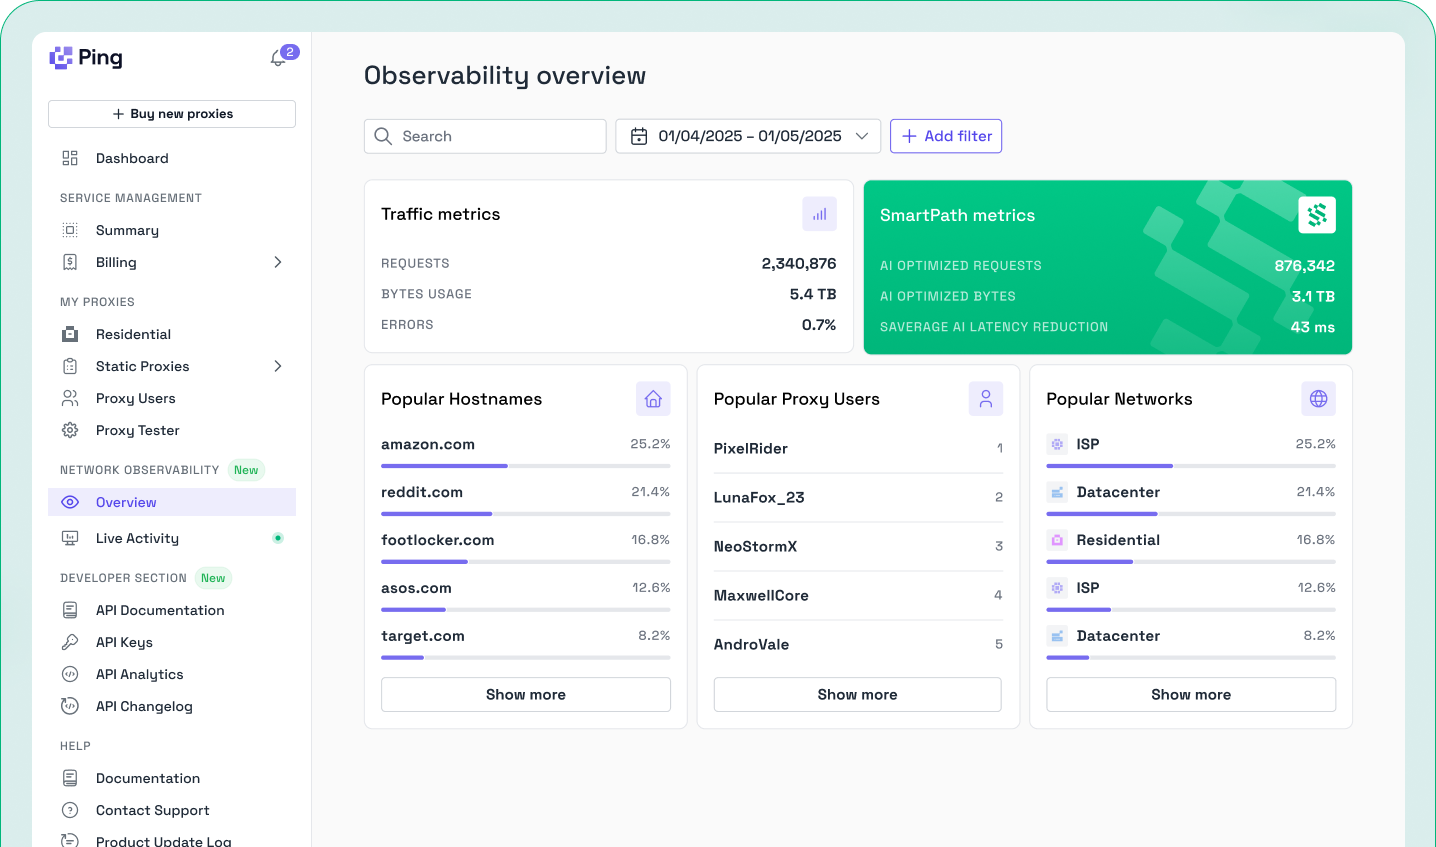
At the bottom of the observability panel, a detailed activity table logs all traffic events by the hour, grouped by:
* Timestamp
* Proxy User
* Hostname
* Network Type
* Request Count
* Bytes Usage
* Smartpath Savings
* Billed Bytes
## Network Activity Table
At the bottom of the observability panel, a detailed activity table logs all traffic events by the hour, grouped by:
* Timestamp
* Proxy User
* Hostname
* Network Type
* Request Count
* Bytes Usage
* Smartpath Savings
* Billed Bytes